An industrial data platform, restructured for autonomous, human-in-the-loop analytics
Shipped the exploration framework that made a sprawling platform investigable; then designed the autonomous, human-in-the-loop analytics it was built to carry, a system that flags an anomaly, explains it with evidence, and leaves the decision to a person. Under the hood, AI was already computing the data. The domain is a factory floor, but the pattern, an autonomous dashboard that surfaces the issue and the why and leaves the call to a human, is exactly what a data-heavy e-commerce surface needs to catch a conversion regression or a broken flow. Shipped IA; autonomous layer proposed, and labeled as such throughout.
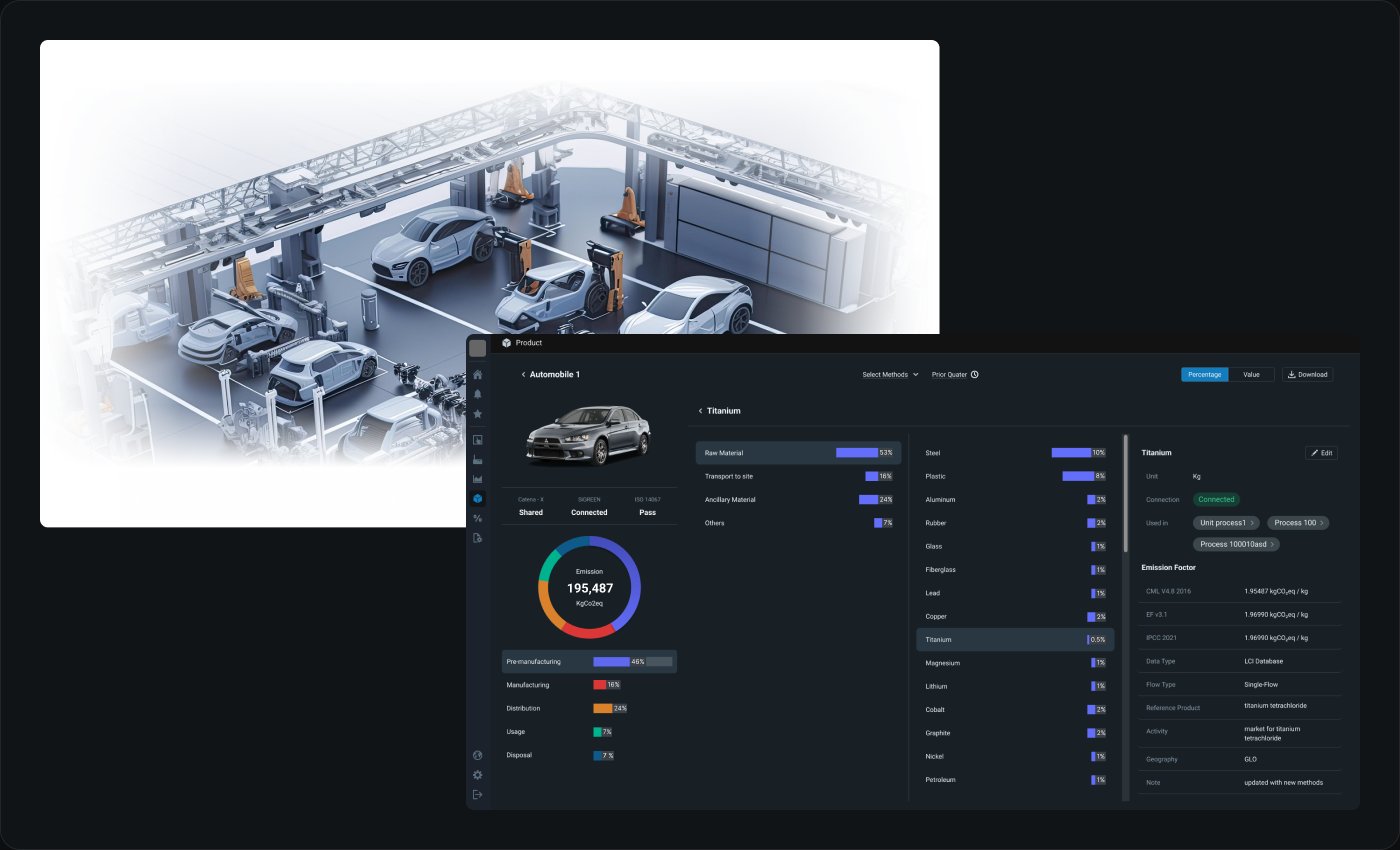
The PCF (product carbon footprint) module: one product's emissions, drillable down to the individual material.
Problem
Omnibus matured faster than its information architecture. Deep navigation trees and a feature-centric structure meant users could describe exactly what they wanted but couldn't reliably find it.
Solution
One exploration framework reused across every module: progressive drill-down, context preserved between screens, and a consistent path from any metric to the record behind it, built to carry an autonomous, human-in-the-loop analytics layer on top.
Practice
I prototyped end-to-end flows in Figma Make, iterating with engineering before handoff. Personas, interview preparation, and analysis ran with AI assistance. Structure first, so intelligence has somewhere to land.
Role
- Led the IA overhaul end-to-end: UX strategy, information architecture, and user research
- End-to-end prototyping and UI design across modules
- Design system, narrative, and art direction
- Prototyped end-to-end flows in Figma Make, iterating directly with engineering before handoff
- Previewed upcoming features with clients, guiding what would change and how, with working prototypes in ProtoPie and Figma Make
Tools
- Figma, design and system source of truth
- Figma Make and ProtoPie, working prototypes for engineering iteration and client previews
- ChatGPT, personas, interview preparation, and analysis
Process
- Research
- The Insight
- The System
- The AI-Native Bet
- Impact & Retrospect
1.
Research
Understanding why users who knew exactly what they wanted still couldn't find it, and where Omnibus sits in the market.
1.1 Competitive Landscape
Industrial platforms like Honeywell Forge and generic observability tools like Datadog or Grafana solve monitoring at the infrastructure level, not the shop-floor investigation level Omnibus targets. In those stacks, root-cause data usually sits behind a separate BI team and a request queue. Omnibus's edge: operations managers explore it directly, no BI request needed.
1.2 An Ecosystem That Outgrew Its Structure
Omnibus had evolved into a powerful industrial data platform spanning operational monitoring, sustainability analytics, and supply chain intelligence. As new capabilities were added, information became increasingly fragmented across modules, reports, and workflows. The platform had matured. Its user experience had not.
Users knew what they wanted. Finding it was the challenge.
1.3 How the Research Ran
The research started in the field, not at a desk: I went on-site to a running factory, hard hat on the floor, to watch how operators actually use the platform and interview the real field users, alongside the team. From there, AI carried the preparation and the paperwork while people carried the judgment. I used AI, mostly ChatGPT, to draft the personas, prepare the interview guides, and analyze what the interviews brought back. The personas then earned their keep beyond research: aligned to them, we generated options for the platform's tone of voice and decided as a team how Omnibus should talk to its users. AI then carried that decided voice into the languages of each market Omnibus serves, so it stays one voice everywhere.
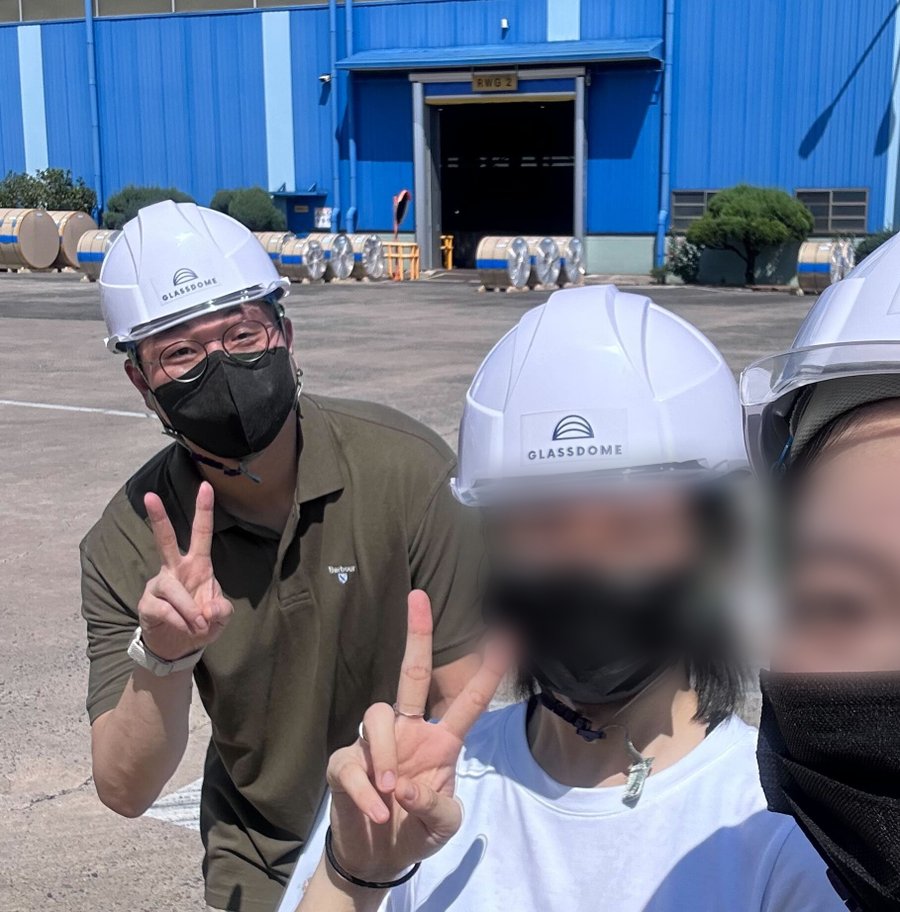
On-site at a running factory, interviewing the operators who actually use Omnibus. Field research grounded the redesign before any AI synthesis. (Teammates' faces blurred for privacy.)
Key findings
- The platform matured faster than its IA: deep navigation trees, multiple entry points, and a feature-centric structure.
- Plant operations managers and sustainability leads could describe the problem they were investigating but couldn't reliably find the data to confirm it.
- That's a usability symptom of a structural issue: the architecture mirrored the product's features, not the user's investigation.
One finding from that field visit turned into a direct proposal: design pushed to add a tablet UX, mounting a tablet on the on-site equipment so an operator could log and assess an issue on the spot the moment it came up, instead of writing it down and reporting it later. It improved on-site usability and got strong, direct positive feedback from the field.
2.
The Insight
Users weren't searching for data. They were investigating operational issues
The issue wasn't usability. It was information architecture. Omnibus was organized around its features; its users' mental model was an investigation: notice a symptom, drill into the analysis, find the record behind it, confirm the cause. So the fix wasn't better search or shallower menus. It was rebuilding the structure around the investigation itself: progressive drill-down, context preserved across modules, and one consistent way to get from any metric to the evidence behind it.
3.
The System
One exploration framework, shipped across modules already in production: designing for an ecosystem, not a screen.
3.1 Before: Deep Navigation Trees
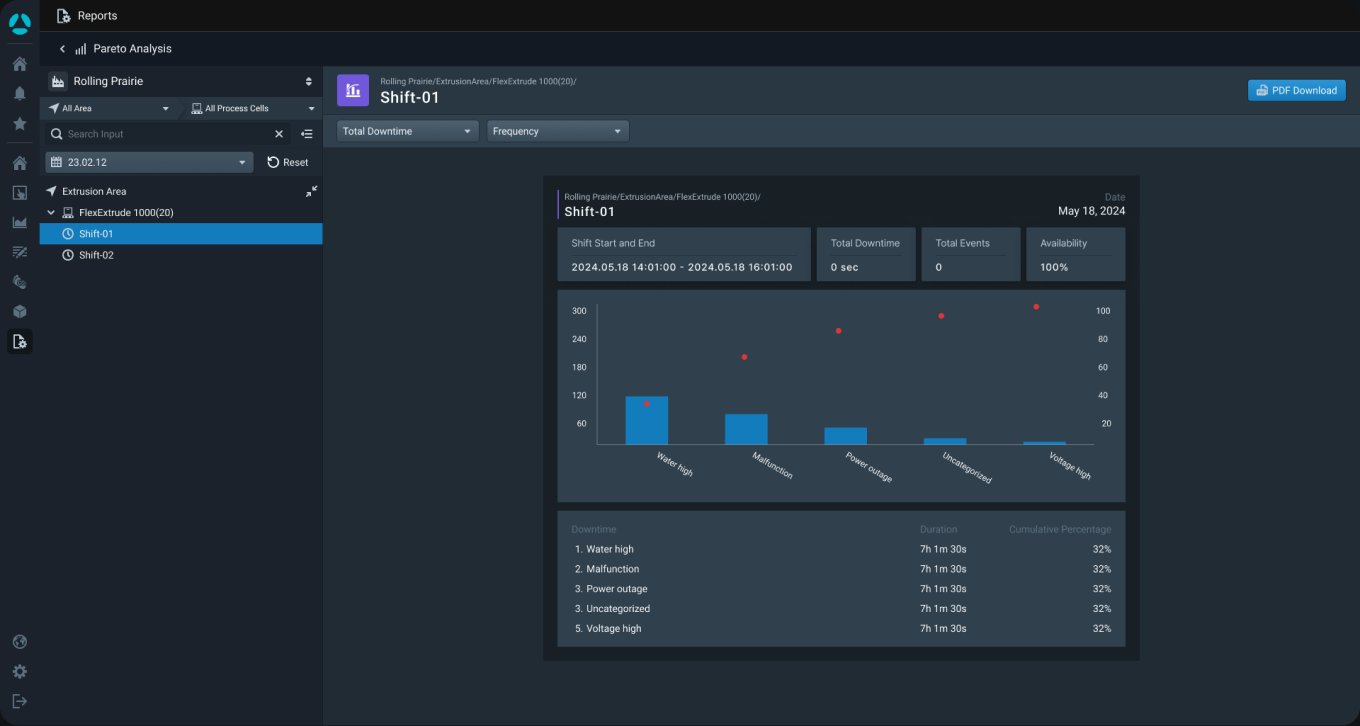
BeforeThe old structure mirrored the product's features. Reaching a Pareto analysis meant descending a deep tree, and the metrics that raised the question lived somewhere else entirely.
3.2 Improved: Progressive Drill-Down
ImprovedRebuilt around the investigation: the OEE overview surfaces the symptom, and the same screen drills straight down to the machine-level records behind it. Symptom to root cause without re-orienting.
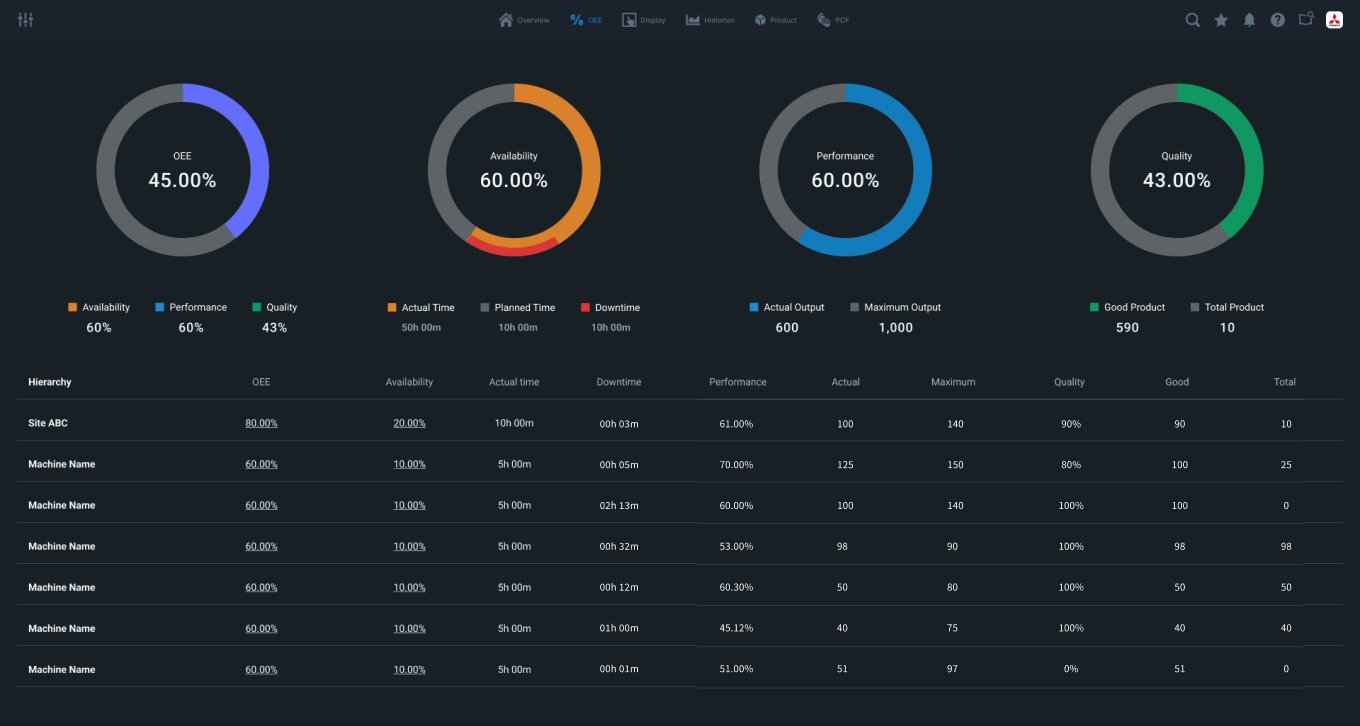
The constraint that shaped it: this had to land inside OEE and Pareto reporting modules already in production, and scale to new capabilities without a redesign each time. That constraint is what made a framework, rather than a facelift, the right answer.
3.3 One Framework, Every Module
The same drill-down grammar carries into history and records. Once learned, the pattern transfers: a user who can investigate an OEE drop can investigate a carbon spike, because the structure underneath is identical. New capabilities like carbon analytics shipped into this framework instead of demanding a new structure.
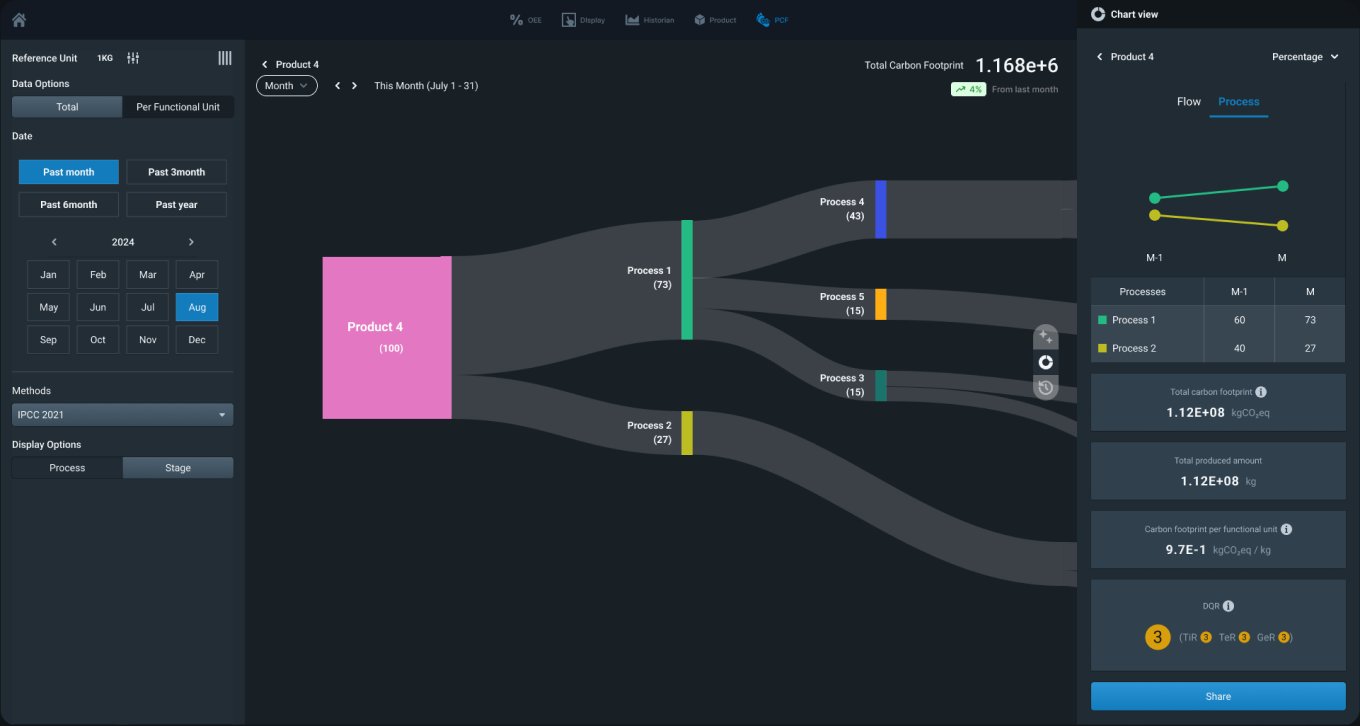
History and records in the same grammar: from any metric to the events behind it, without re-learning the platform.
3.4 Landing the Change with Clients
A production platform can't change under its users' feet. Before release, we previewed upcoming features with clients and walked through what would change and how, using working prototypes in ProtoPie and Figma Make instead of slide decks. Clients reacted to real behavior before release, so the new structure arrived as a guided step, not a surprise.
4.
The AI-Native Bet
How AI already worked on this project, the assistant the IA anticipates, and the operating model to ship it responsibly.
AI was in the workflow before it was on the roadmap
Personas, interview preparation, and interview analysis ran with AI assistance, mostly ChatGPT. The persona work then carried into the product's voice: aligned to it, we generated tone-and-voice options for how Omnibus talks to its users, decided as a team, and used AI again to translate the decided voice into the languages of each market, one voice everywhere. And AI wasn't only in the design workflow: under the hood, Omnibus already used it to calculate the data gathered by PLC gateways and modules. At some sites, that cut two to three months of data management work down to weeks. That's the same pattern this act proposes for the user-facing layer: AI does the heavy computation, people make the call.
4.1 An IA Restructured for a Chatbot That Didn't Exist Yet Proposed, not shipped
The exploration framework wasn't just a usability fix. It was built around a specific bet: a future assistant would need to answer a question and immediately ground it in the overall picture, not send the user back into a module to find it themselves. Progressive drill-down, shared navigation, and preserved context are the scaffolding a conversational layer needs to point at real data and show it, not just describe it. And the bet had precedent: AI was already at work in the platform's data layer.
Concept sketch, not built. Illustrative only.
Overview
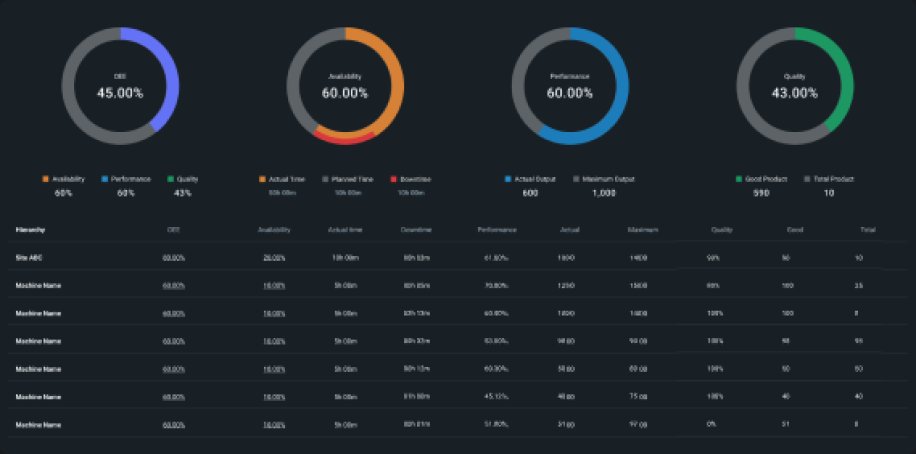
Ask Omnibus
Line 4 dropped 12pts, driven by a changeover delay.
→ highlighted at leftThe answer doesn't replace the overview. It points at it. Every response is grounded in the same screen the user was already looking at.
This is the kind of forward-structuring that's easy to skip under deadline pressure, but it's the difference between bolting AI on later and being ready for it when it arrives.
4.2 AI-Native Patterns Proposed, not shipped
Three pattern types extend the same exploration framework into autonomous, human-in-the-loop analytics: a system that flags, explains, and lets you decide.
OEE on Line 4 dropped 12pts vs the 30-day baseline.
Flagged automatically at 06:12, before the shift report.
View trend →
Likely cause: changeover delay after the 05:40 batch switch
71% confidence, based on 18 similar changeovers.
Trend summary
Carbon intensity per unit is down 4% this quarter, driven mainly by Line 2's new schedule, not the material substitution piloted in March.
Source: PCF module, Q2Human-in-the-loop by default: every alert ships with its evidence, every suggestion with a confidence score and an explicit accept or reject. Never a silent auto-fix on a production line.
Why this transfers. The domain here is a factory floor, but the pattern is domain-agnostic: flag an anomaly, explain it with evidence, let a human decide. It's the same autonomous dashboard an e-commerce team needs to catch a conversion regression or a broken checkout, surface the issue and the why, and leave the call to a person. Data-driven design and autonomous, human-in-the-loop analytics are the transferable skill here; the product just happens to be industrial.
4.3 The Operating Model Designed, pending rollout
These patterns are proposed, not shipped, so there's no usage data to report yet. This is the rollout plan: how design, engineering, and data science would operationalize human-in-the-loop AI inside the existing workflow, not just the UI.
Design critique
A weekly checkpoint reviewing false-positive and false-negative anomaly alerts before any pattern moves from shadow mode to default-on.
Design-engineering handoff
Confidence thresholds and citation requirements become part of the component spec itself. Data science signs off alongside design, not after.
Internal playbook
A short, living doc on how to word and tune AI suggestions (structure, tone, when to suppress) sits next to the design system docs, not buried in a wiki.
Design QA
Human-in-the-loop becomes a testable QA gate: every AI surface must expose an explicit accept or reject before it ships, the same way accessibility checks gate a release today.
5.
Impact & Retrospect
What changed, and what I can and can't claim credit for. Reported honestly.
- Context
- The IA had fragmented across modules as Omnibus grew. Operations managers could describe the problem they were investigating but couldn't reliably find the data to confirm it: a usability symptom of a deeper structural issue.
- Intervention
- Replaced the deep, feature-centric navigation with a shared exploration framework: progressive drill-down, preserved context across modules, and a consistent pattern for moving from a metric to the record behind it.
- Evidence
- Direct: markedly improved live product demonstrations, used confidently in front of new prospects. Indirect and shared: the redesigned platform contributed to positive customer feedback around the same period as growth across its markets, Korea, the US, Vietnam, and the EU, alongside sales and market-entry work I wasn't responsible for. Design's slice of that localization was the product voice, decided once and carried into each market's language with AI assistance. I'm not claiming the expansion as a design-only outcome.
- Business value
- A reusable IA foundation meant new capabilities like carbon analytics could ship into the existing framework instead of requiring a new structure each time: the main lever for the AI-native patterns proposed above.
- In business terms
- Faster live demos shortened sales cycles enough to matter in expansion conversations, and a reusable IA foundation avoids a redesign each time a new module ships. On the engineering side, AI calculating the data from PLC gateways and modules compressed per-site implementation: at some sites, two to three months of data management team work came down to weeks.
- What's next
- The anomaly, root-cause, and trend-summary patterns above are proposed, not shipped. Before rollout, I'd want a real before-and-after on task time for a root-cause investigation, with an actual baseline, not a retrofitted number.
What I learned
- Before adding intelligence, understand the field and your users, and how they actually use the product. An assistant on top of a fragmented IA just describes the mess faster.
- Prototype where engineering can react. Working end-to-end flows in Figma Make, iterated together before handoff, beat static specs and a prayer.
The system's job was never to look impressive in a demo. It was to let someone go from "something's wrong" to "here's why" without re-learning the platform each time, and to do that whether the answer comes from a person or a model.